ORIGINAL PAPER
JOURNAL OF THE FACULTY OF HUMAN MEDICINE 2020 - Universidad Ricardo PalmaDOI 10.25176/RFMH.v20i3.2904
FACTORS ASSOCIATED WITH OVERWEIGHT AND OBESITY IN WORKERS OF PIURA-PERU
FACTORES ASOCIADOS A SOBREPESO Y OBESIDAD EN TRABAJADORES DE PIURA-PERÚ
Christian R. Mejia1,a, Franklin Llontop-Ramos2,b
,Claudia A. Vera2,b, Onice J. Caceres2,b
1 Universidad Continental. Lima, Perú
2Asociación Médica de Investigación y Servicios en Salud. Lima, Perú.
aMaster in Occupational Health
b Medical Surgeon
ABSTRACT
Introduction: Obesity is a public health problem, which also affects the work sector. Objective: Determine the factors associated with overweight and obesity in Piura workers. Methods: A cross-sectional study, using secondary database. We used the occupational exam records of workers of companies in Sechura – Piura. The main variable was the BMI classification (normal/overweight/obese). Descriptive results and the association between the type of BMI and other variables were presented. Results: Of the 1203 workers who met the selection criteria, 93.2% (1121) were male, and had a median age of 31 (range: 18-63). Significant difference between BMI with respect to waist circumference, hip diameter, hemoglobin, cholesterol, triglycerides, HDL, LDL and glucose was found. In addition to gender, age and type of test (entrance/periodic/retirement). The study showed no significant differences from the place of birth or residence. Conclusions: There were differences in all the physio-anthropometric parameters evaluated with respect to BMI, except birthplace/residence, which shows that the risk of the working population should not be assessed by these demographic characteristics. Work programs to improve global health should be generated.
Keywords: Obesity, Overweight, Occupational Health. (Source MeSH NLM).
RESUMEN
Introducción: La obesidad es un problema de salud pública, la cual afecta también al sector laboral.
Objetivo: Determinar los factores asociados a sobrepeso y obesidad en trabajadores de Piura.
Métodos: Estudio transversal analítico, usando una base de datos secundarios. Se emplearon los registros de los exámenes ocupacionales tomados a trabajadores de empresas en Sechura – Piura. La variable principal fue la clasificación
según IMC (normal/sobrepeso/obesidad). Se presentaron los resultados descriptivos y se encontró la asociación entre el tipo de IMC y las otras variables.
Resultados: De los 1203 trabajadores el 93,2%(1121) fueron varones, con una mediana de 31 años (rango: 18 a 63 años). Se encontró diferencia significativa entre el IMC con respecto a diámetro de cintura, diámetro de cadera, hemoglobina,
colesterol, triglicéridos, HDL, LDL y glucosa. Además del sexo, la edad y el tipo de examen (de entrada/periódico/retiro). El estudio no mostró diferencias significativas con respecto al lugar de nacimiento o residencia.
Conclusiones: Se encontró diferencias en todos los parámetros fisio-antropométricos evaluados, pero no según el lugar de nacimiento/residencia, lo que nos indica que la vigilancia ocupacional en este grupo no debe basarse en sus características
demográficas, debiendo generarse programas laborales para tratar de mejorar la salud global.
Palabras Clave: Obesidad, Sobrepeso, Salud Laboral. (Fuente DeCS BIREME).
According to the WHO, there is approximately 2 billion overweight adults and a third of whom are obese(1),in part due to the advancement in technology and the industry development which have generated that the productive processes depend greatly on machines, this has decreased the daily use of energy throughout the years; it is estimated at an average decrease of 100 calories/day/worker(2), in addition to lifestyle changes, harmful habits and mental factors(3-5). All of these could lead to problems related to their daily work, even reaching work termination6,7; becoming more serious in those jobs with greater tension within and outside of work(8-10).
Nutrition in the workplace is another very important factor, little variety or the perception of unhealthy food is related to overweight among workers(11); some reports indicate that one out of three professionals are overweight and one out of thirteen suffer from obesity(12,13), more evident among lower income work groups(14), those with seniority(15,16), depending on their responsibility/hierarchy17,18, the type of activity they perform daily(19,20), and even the field of the company(21), in addition to finding elevated glucose and lipid panel levels(6,12). This has not been studied in our environment, consequently the objective of this study was to determine the factors associated with overweight and obesity in Piura workers that are seen in a private health institution.
METHODS
Design and setting
A cross-sectional study, with secondary data base analysis. Database used was generated by the medical exams performed on the workers of diverse companies.
Population and sample
We evaluated workers examined in Cismedic, a private health entity in the Sechura district in Piura, in the north coast of Peru. The majority of these workers originated from the same city in Piura or surrounding cities, belonged to different socioeconomic levels, selected a census type sample of those attended. We included workers over the age of 18, who had an occupational exam that included the measured variables and whose weight was considered normal, overweight and or obese, we excluded 8 workers who had consumed psychoactive substances since this might interfere with the bloodwork results.
Variables and instruments
The main variables were the presence of overweight or obesity in the evaluated workers, defined by a body mass index (BMI) between 25-29.9 kg/m2 and >30 kg/m2, respectively. This was in contrast to those who had a weight considered normal (BMI between 18.5-24.9 kg/m2. Other variables obtained were worker gender (masculine/feminine), age (quantitative variable), place of birth and current residence (Piura, not Piura and northern, central, southern regions of Peru, and foreigner category), type of job they performed (administrative/laborer) and the type of medical occupational exam performed (entrance/periodic/retire).
Procedures
After obtaining the required consents, we had access to the medical records generated during the medical visit for each worker, these were created according to the laboratory results and the anthropometric measurements company forms. Then the data was passed to a sheet generated by the Microsoft Excel program (for Windows version). This was performed by a data entry person trained by the primary author of this study.
The circumference variables were taken according to the World Health Organization recommendations; the waist circumference was performed with the adequate intimacy to take these measurements, attempting without clothing, meaning directly over the skin, when this was unattainable, we considered it acceptable to measure the waist circumference over a fine fabric, but not over thick or voluminous fabric(22). This measurement was taken after a normal exhalation, with arms relaxed to the sides, at the height of mid- axillary region, at the meeting point between the lower part of the last rib and the highest point of the hip. We stood next to the participant, tracing the lower point of the last rib and the iliac crest (highest point of the hip bone) which was marked with a fine point pen. With a measuring tape, we found the central point between these two marks. We placed the measuring tape over the point indicated in the prior phase and asked the participant to roll in it (making sure the tape was in a horizontal position surrounding the participant’s entire body). The participant was asked to stand with both feet together and arms at their sides with palms facing inward and exhale slowly. The waist circumference was measured, and the result was read with a 0.1cm precision on the tape.
The hip diameter was measured keeping the same adequate intimacy (with similar indications as the waist circumference). This measurement was taken with arms relaxed at their sides, at the widest location above the buttocks, standing next to the participant, the measuring tape was placed at the widest location of the buttocks, while asking the participant to remain standing, with feet together and arms at their side palms facing inward and exhaling slowly. We verified the tape was in a horizontal position surrounding the entire body. The hip diameter was measured, and the result was read with a 0.1 cm precision on the tape.
Furthermore, the laboratory test results were obtained for hemoglobin, cholesterol, triglycerides, HDL, LDL, and blood glucose. These were taken by a certified health professional, using adequate equipment for each case (colored tubes appropriate for each sample type), with a standard technique and explaining that this was part of the regular occupational exam. The blood samples were analyzed in a device that held the necessary certifications and that was constantly calibrated by trained personnel.
Statistical analysis
Prior to the statistical analysis, a data debugging process was carried out, in order to find anomalous and/or incongruent data. These data were eliminated to perform the analysis with the Stata version 11.1 statistical program.
The descriptive statistic was performed by means of frequencies and percentages for the categorical variables. The mean/standard deviation was used for the quantitative variables, except for the worker age variable, which was described by the median and the ranges due to it being of an abnormal type, post-evaluation by means of the Kolmogorov/Smirnov statistical test.
The chi squared test was used for the crossing of categorical variables. The Analysis of Variance (ANOVA) was used for the crossing of the categorical-quantitative variables. The values p<0.05 were considered statistically significant.
Ethical aspects
The Project was approved by the Ethics Committee of the Hospital San Bartolome (Code: 1371-DG-OADI-N° 0378 -HONADOMANI-SB-2014) and by the Ethics Committee of the Universidad Científica del Sur.
RESULTS
Of the 1203 workers who met the selection criteria, 93.2% (1121) were males and had a median age of 31 years (range: 18 to 63 years of age). The majority were born in Piura (62.3%) and currently reside in a city in the northern part of Peru (75.6%). 90.2% (1081) worked in a labor or field position. The labor characteristics of the workers are shown in table 1.
Table 1. Labor characteristics of workers in a district of Piura.
|
Variable |
N |
% |
|
Sex |
|
|
|
Masculine |
1121 |
93,2 |
|
Feminine |
82 |
6,8 |
|
Age (years)* |
31 |
18-63 |
|
Birthplace£ |
|
|
|
North |
932 |
77,8 |
|
Center |
221 |
18,4 |
|
South |
31 |
2,6 |
|
Foreigner |
14 |
1,2 |
|
Currently reside£ |
|
|
|
North |
911 |
75,6 |
|
Center |
267 |
22,2 |
|
South |
18 |
1,5 |
|
Foreigner |
5 |
0,4 |
|
Type of job |
|
|
|
Administrative |
118 |
9,8 |
|
Laborer/Field work |
1081 |
90,2 |
Figure 1 Shows the frequencies of BMI according to the place of birth (A), type of job position (B), and gender (C). We can observe that overweight is the most frequent category, with 4-5 for every 10 workers surveyed, obesity frequencies were always between 7-20%.
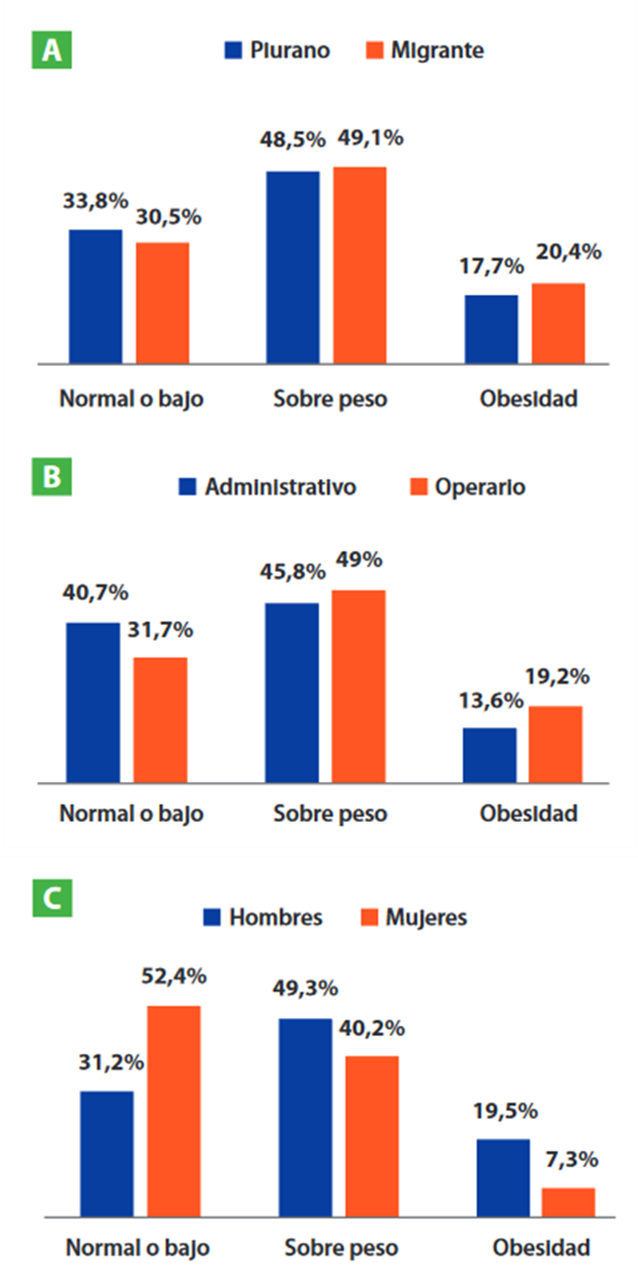
Figure 1. Body mass index type according to worker’s place of birth (A), type of job position (B) and gender (C) in a district of Piura.
Of all the occupational exams, 84.4% (105) were at entrance, 7.3% (88) were annual and 8.3% (100) were at retirement. When they were categorized according to their BMI, 32.7% (393) were normal or low weight, 48.7% (586) were overweight and 18.6% (224) were obese. The anthropometric and laboratory values were all different according to the BMI categories, shown in Table 2.
Table 2. Anthropometric and laboratory values according to the body mass index (BMI) of workers in a district of Piura.
|
Variables |
Medium according to body mass index (standard deviation) |
p-value |
||
|
Normal or low |
Overweight |
Obesity |
||
|
Waist circumference |
80,3 (5,9) |
90,9 (6,3) |
102,4 (9,3) |
<0,001 |
|
Hip Diameter |
91,2 (4,8) |
98,3 (5,0) |
105,7 (12,6) |
<0,001 |
|
Hemoglobin |
14,9 (1,0) |
15,1 (1,0) |
15,3 (1,0) |
<0,001 |
|
Cholesterol |
155,3 (29,7) |
170,8 (32,8) |
184,2 (33,9) |
<0,001 |
|
Triglycerides |
114,3 (59,3) |
154,3 (78,0) |
190,4 (96,3) |
<0,001 |
|
HDL |
66,7 (11,1) |
68,7 (11,2) |
69,8 (10,4) |
0,003 |
|
LDL |
71,6 (23,1) |
83,9 (25,1) |
95,2 (28,0) |
<0,001 |
|
Glucose |
82,8 (9,0) |
85,5 (15,5) |
89,2 (16,0) |
<0,001 |
Once the BMI values were determined according to the workers’ characteristics, we observed that there was a statistically significant difference regarding the worker’s gender (p<0,001), given that the frequencies increase in men until they reach obesity. We also found differences in the age averages (p<0,001), given that those that were overweight and obese had 5.1 and 8.6 more years on average, respectively. We also found that, according to exam type, the frequencies of overweight and obesity varied. Type of worker showed no significant difference according to the BMI. When the BMI categories were crossed depending if worker was born in Piura (p=0,368) or born in another region (p=0,710), there were no statistically significant differences. Likewise, when they were asked if they currently resided in Piura (p=0,611) or in another region (p=0,386). These results are shown in table 3.
Table 3. Workers’ socio-demographic characteristics according to workers’ body mass index (BMI) in a district of Piura.
|
Variables |
Frequency according to body mass index (percentage) |
p-value |
||
|
Normal or low |
Overweight |
Obesity |
||
|
Gender |
|
|
|
|
|
Masculine |
350 (89,0) |
553 (94,4) |
218 (97,3) |
<0,001 |
|
Feminine |
43 (11,0) |
33 (5,6) |
6 (2,7) |
|
|
Age (years) |
29,0 (7,6) |
34,1 (9,3) |
37,6 (9,8) |
<0,001 |
|
Exam type |
|
|
|
|
|
Entrance |
342 (87,0) |
479 (81,7) |
194 (86,6) |
0,025 |
|
Annual |
18 (4,6) |
51 (8,7) |
19 (8,5) |
|
|
Retirement |
33 (8,4) |
56 (9,6) |
11 (4,9) |
|
|
Type of Worker |
|
|
|
|
|
Administrative |
48 (12,3) |
54 (9,3) |
16 (7,1) |
0,096 |
|
Laborer |
343 (87,7) |
530 (90,8) |
208 (92,9) |
|
|
Born in Piura |
252 (64,6) |
362 (62,0) |
132 (58,9) |
0,368 |
|
Place of birth |
|
|
|
|
|
North |
314 (80,5) |
446 (76,4 |
172 (76,8) |
0,710 |
|
Center |
65 (16,7) |
112 (19,2) |
44 (19,6) |
|
|
South |
7 (1,8) |
19 (3,3) |
5 (2,2) |
|
|
Foreigner |
4 (1,0) |
7 (1,2) |
3 (1,3) |
|
|
Residing in Piura |
270 (68,9) |
387 (66,0) |
147 (65,9) |
0,611 |
|
Place of residence |
|
|
|
|
|
North |
309 (78,8) |
428 (73,0) |
174 (78,0) |
0,386 |
|
Center |
79 (20,2) |
144 (24,6) |
44 (19,7) |
|
|
South |
3 (0,8) |
11 (1,9) |
4 (1,8) |
|
|
Foreigner |
1 (0,3) |
3 (0,5) |
1 (0,5) |
|
DISCUSSION
Overweight and obesity are directly related to the short-term and long-term increase in pathologies. Sleep apnea can be produced in the short-term(23), musculoskeletal alterations can be produced in medium to long-term time frame, since the body supports the greater joint pressure in the spine(23); and knees(26) for a long period of time. Likewise, there exists a relationship between obesity and coronary disease(27).
The physio-anthropometric parameters showed differences in their median values, which is logical since BMI is actually a measure that adequately classifies the subjects according to their weight, which allows this division to be in agreement with the physiology of the subjects evaluated, a research performed on first level attention medical personnel in the region of Aguascalientes found differences existed according to their cardiovascular risk(28).
There were differences in the workers’ gender, there were more overweight men than women (49.3% vs 40.2%) and more obese (19.5% vs 7.3%), similar results to those found by Ramón Arbués et al with respect to overweight in which men have a greater prevalence (45.2% in men and 24.8% in women), and this difference persisted in obesity cases (15.9% in men and y 8.7% in women) in a group of 23729 community workers of Aragon(31). In another health group(13), Myers et al found that 28% of dentists were overweight and 7% obese(13). We also found statistically significant differences in age and exam type, due to physiological changes that originate as people increase in age and work seniority, as another local study shows, where we observe that workers with over 30 years of age have greater cardiovascular risks compared to younger workers(29), another Peruvian report showed that age is a very influential in metabolic syndrome among miner workers(30). This may be important for follow up in the male population, who are older and have longer time in the company, since they could be exposed to greater risks, reason why occupational medicine areas of each company should watch for the results and follow-up.
No statistical differences were found according to employee type, place of birth or residence, which agrees with a research performed by Proper et al., who found that those who work in commerce, industry, transportation, legislation and high administrative roles had frequencies only slightly higher than overweight (37% and 36%, respectively) and obesity (6.9% and 7.5%, respectively)(21). All of this shows us that minimal differences exist between the work and residence subgroups, since some, due to their physical activity, generate a greater energy consumption, but in generating this, they also consume more food. We can also explain that no statistically significant differences were found between laborers and administrators because currently laborers do not engage in physical activity as in previous years; this due to the great technology that the industry now uses, which causes that physical exertion be reduced to the necessary minimum(2). This is why monitoring programs should perform the follow-up equally to both work groups.
We were not able to study other variables because it was a retrospective study in which we used an already generated database, which made it impossible to manage other factors that could be just as important., as are measurements of other physiological and social parameters that may be important(13); furthermore, we performed a non-probability sampling and we counted with only one branch, however, the results presented were the first reported in this work population which include important work environment variables31 and that may serve as a basis for future research in this and other similar populations.
CONCLUSION
According to the population studied, we conclude that there exist statistically significant differences in the body mass index of workers according to their waist circumference and hip diameter, as well as, according to the laboratory exam values, the type of occupational exam, gender and worker age. We did not find differences in type of worker, place of birth or worker residence.
Author's contribution: The authors participated in the genesis of the idea, project design, data collection and interpretation, analysis of results and preparation of the manuscript of the present research work.
Funding sources: Self-financed.
Conflict of interest: Llontop was a doctor at the institution where the data was obtained.
Received: March 14, 2020
Approved: April 17, 2020
Correspondence: Christian R. Mejia
Address: Av. Las Palmeras 5713, Los Olivos, Lima 39, Lima, Perú.
Telephone number: +51 997 643 516
E-mail: christian.mejia.md@gmail.com
BIBLIOGRAPHIC REFERENCES