ARTICULO ORIGINAL
REVISTA DE LA FACULTAD DE MEDICINA HUMANA 2021 - Universidad Ricardo PalmaDOI 10.25176/RFMH.v21i1.3307
APPLICATION OF THE AUTOREGRESSIVE INTEGRATED MOVING AVERAGE FOR THE ANALYSIS OF COVID-19 CASE SERIES IN PERU
APLICACIÓN DEL MÉTODO AUTORREGRESIVO INTEGRADO DE MEDIAS MÓVILES PARA EL ANÁLISIS DE SERIES DE CASOS DE COVID-19 EN PERÚ
Daniel Angel Córdova Sotomayor1,a,b,Flor Benigna Santa Maria Carlos2,a,c
1Facultad Integrada de Medicina, de Estomatología y de Enfermería, Universidad Peruana Cayetano Heredia. Lima, Perú
2Ministerio de Salud. Lambayeque, Perú
aDental surgeon
bMagister in Education
cMagister in Health Services Management
Introduction: In recent months, researchers have been using mathematical methods to forecast the number of COVID-19 cases worldwide. Objective: To estimate an Autoregressive integrated moving average (ARIMA) to analyze a series of COVID-19 cases in Peru. Methods: The present study was based on a univariate time series analysis; The data used refers to the number of new accumulated cases of COVID-19 from March 6 to June 11, 2020. For the analysis of the fit of the model, the autocorrelation coefficients (ACF), the unit root test of Augmented Dickey-Fuller (ADF), the Normalized Bayesian Information Criterion (Normalized BIC), the mean absolute percentage error (MAPE), and the Box-Ljung test. Results: The prognosis for COVID-19 cases, between June 12 and July 11, 2020, ranges from 220 596 to 429 790. Conclusions: The results obtained with the ARIMA model, compared with the observed data, show an adequate adjustment of the values. Although this model is easy to apply and interpret, it does not simulate the exact behavior over time. It can be considered a simple and immediate tool to approximate the number of cases.
Keywords: Forecasting; Pandemics; Coronavirus (Source: MeSH MLN)
The new coronavirus (severe acute respiratory syndrome coronavirus 2-SARS) was reported in December 2019 in Wuhan-China, with the appearance of several cases of pneumonia of unknown etiology which caused severe acute respiratory problems (1-7). This infection is transmitted by inhalation of respiratory droplets, close contact with the infected individual, and contact with contaminated surfaces or objects (1,8).
On March 11, 2020, the World Health Organization (WHO) declared COVID19 a pandemic (9). Cases are increasing worldwide, including Peru, where the first case was announced on March 6; As of July 12, the total number of confirmed cases was 326,326 (10).
There is great concern about the Peruvian health system’s response capacity to effectively meet the needs of people with COVID-19 as the number of cases increases. Despite all the measures taken by the government, it does not stop. The outcome is worst now that the government “opened the doors” for the population to a “new normal.”
Mathematical models are used to understand critical epidemiological transitions (11-14), and in recent months, researchers have been using mathematical methods to forecast the number of COVID-19 cases worldwide. The Autoregressive Integrated Method of Moving Averages (ARIMA) is the one that has been used the most to make forecasts, such is the case of those proposed by Singh RK et al. ( 11), for the United States, Spain, Italy, France, Germany, the United Kingdom, Turkey, Iran, China, Russia, Brazil, Canada, Belgium, the Netherlands, and Switzerland; by Ceylan Z (15), for Italy, Spain, and France; by Moftakhar L and Seif M(1), for Iran; by Benvenuto D et al. (16), for Italy; by Yousaf M et al. (17), for Pakistan; by Hiteshi Tandon(18) and Rishabh Tyagi et al. (19), for India and by Perone G(20), for Italy
Time series constitute data collections in a period in which trends or patterns are observed to forecast some future values (21). The ARIMA model has three main parameters; the parameter p: associated with the autoregressive process (AR), the number of differences that must be taken from the series to be stationary. The parameter d: associated with the integrated part (I) y; the parameter q: related to the part of the moving average (MA), which is the current value of a series, which is defined as a linear combination of past errors(11,12,18).
To estimate an ARIMA model, the Box-Jenkins methodology(11, 22-23), is used, which consists of 4 stages. Identification: which consists of identifying the model that can tentatively be considered. Estimation: which consists of estimating the parameters of the model tentatively considered; validation: which consists in performing diagnostic tests to check if the model fits the data. Finally, prediction, which consists of obtaining forecasts in probabilistic terms of future values and the model’s predictive capacity, is evaluated(24).
One of the concerns in Peru and any other country, is to know how many people will be infected with COVID-19 in time; and this could be answered with predictive models(25); Therefore, the present study aimed to estimate an Autoregressive Integrated Moving Average model (ARIMA) for the analysis of series of COVID-19 cases, in Peru, t seek an approximation between the results obtained with the model and observed data.
METHODS
Design and study area
This study was based on a univariate, descriptive, cross-sectional, retrospective time series analysis, carried out in Peru, with the number of new daily confirmed cases of COVID-19, between March 6 and March 11. June 2020.
Population and sample
The data used refers to the total number of new daily confirmed cases of COVID-19 between March 06 and June 11, 2020.
Variables and instruments:
The data comes from the COVID-19 Situation Room -Peru, from Instituto Nacional de Salud y Centro Nacional de Epidemiologia, Prevención y Control de Enfermedades del Ministerio de Salud(10); which serve to obtain the accuracy of the forecast of the spread of COVID-19.
Procedures
The data was used to obtain the forecasts of the number of cases for the next 30 days, from June 12 to July 11, 2020, creating a projected trajectory of these cases, to later compare them with the cases observed in the indicated period.
Statistical analysis
The time series method used for the forecast of COVID-19 cases was the Integrated Autoregressive Moving Averages of order (p, d, q) or ARIMA (p, d, q). The construction of the model was carried out iteratively following the 4 stages of the Box-Jenkins methodology(11, 22-24) 1-Identification: in which the stationary transformation of the series was determined to obtain the appropriate model, through the analysis of autocorrelation coefficients (ACF), and the Augmented Dickey-Fuller unit root test (ADF); 2-Estimation: in which, by choosing the appropriate orders p, d, q, the model was adjusted to the time series, obtaining the ARIMA model (0,2,9); 3-Validation: in which it was analyzed if the model was appropriate, and it was valued with the Normalized Bayesian Information Criterion (Normalized BIC), the mean absolute percentage error (MAPE) and the white noise test or Box-Ljung test; 4-Prediction: in which the forecasts of the number of cases for the next 30 days were generated; and then compare the observed cases.
The statistical program used for the time series analysis was the SPSS version 22, and the STATA version 15 program was used to determine the increased Dickey-Fuller unit root contrast.
Ethical aspects
The data is public, open, and has anonymous access. Therefore, the approval of an institutional ethics committee was not required.
RESULTS
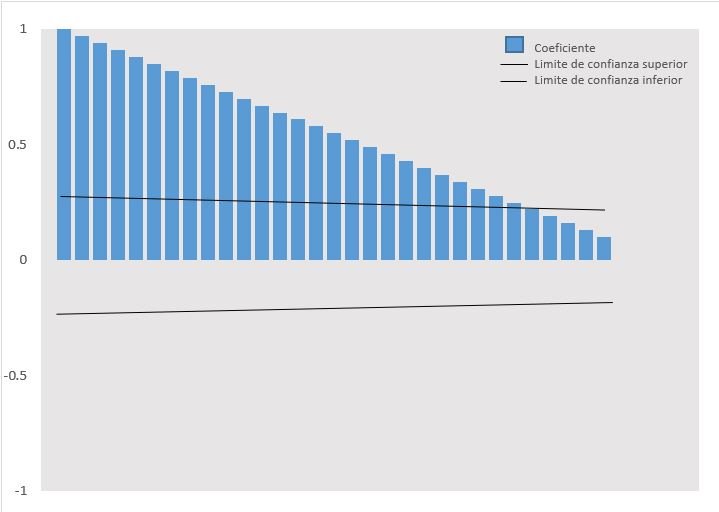
Table 1 shows the daily count of COVID 19 cases between March 6, 2020, and June 11, 2020. In Figure 1, it is shown that the autocorrelation coefficients (ACF) slowly decrease as linear, so they correspond to a non-stationary time series, this being corroborated by the Augmented Dickey-Fuller unit root contrast (p> 0.01).
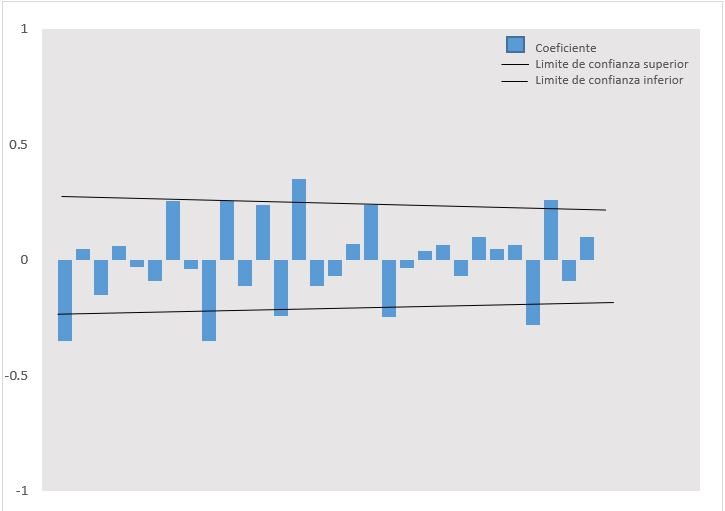
In Figure 2, the second-order stationary transformation is shown. The time series was stabilized by eliminating trends and obtaining the appropriate model with the orders p, d, q, which was ARIMA (0.2, 9). Tabl3 2 shows the parameters (p, d, q) obtained in the modeling process; the Normalized Bayesian Information Criterion (BIC) which indicates that 13,475 was the lowest value obtained indicating the best ARIMA model; the mean absolute percentage error (MAPE) that indicates that the forecast of the model is wrong by 7.775%; and the Ljung-Box test that suggests that the model is capable of reproducing the systematic behavior pattern of the time series.
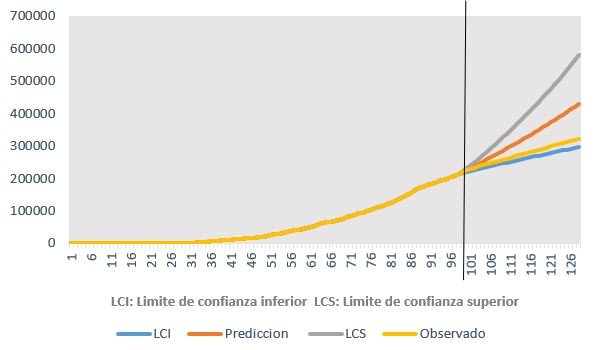
Figure 3 and Table 3 show the prognosis of the number of cases with 95% confidence intervals and the observed cases, from June 12 to July 11, 2020, with data from March 6, 2020, to June 11, 2020. The observed cases’ values are lower than the predicted cases’ values, with those observed within the minimum and maximum values of the estimates.
Table 1. Number of cases with COVID 19 per day, from March 6 to June 11, 2020. Peru
|
Day |
Cases |
Day |
Cases |
Day |
Cases |
Day |
Cases |
|
6/03/2020 |
1 |
31/03/2020 |
1065 |
25/04/2020 |
25331 |
20/05/2020 |
104020 |
|
7/03/2020 |
6 |
1/04/2020 |
1323 |
26/04/2020 |
27517 |
21/05/2020 |
108769 |
|
8/03/2020 |
6 |
2/04/2020 |
1414 |
27/04/2020 |
28699 |
22/05/2020 |
111698 |
|
9/03/2020 |
9 |
3/04/2020 |
1595 |
28/04/2020 |
31190 |
23/05/2020 |
115754 |
|
10/03/2020 |
11 |
4/04/2020 |
1746 |
29/04/2020 |
33931 |
24/05/2020 |
119959 |
|
11/03/2020 |
17 |
5/04/2020 |
2281 |
30/04/2020 |
36976 |
25/05/2020 |
123979 |
|
12/03/2020 |
22 |
6/04/2020 |
2561 |
1/05/2020 |
40459 |
26/05/2020 |
129751 |
|
13/03/2020 |
38 |
7/04/2020 |
2954 |
2/05/2020 |
42534 |
27/05/2020 |
135905 |
|
14/03/2020 |
43 |
8/04/2020 |
4342 |
3/05/2020 |
45928 |
28/05/2020 |
141779 |
|
15/03/2020 |
71 |
9/04/2020 |
5256 |
4/05/2020 |
47372 |
29/05/2020 |
148285 |
|
16/03/2020 |
86 |
10/04/2020 |
5897 |
5/05/2020 |
51189 |
30/05/2020 |
155671 |
|
17/03/2020 |
117 |
11/04/2020 |
6848 |
6/05/2020 |
54817 |
31/05/2020 |
164476 |
|
18/03/2020 |
145 |
12/04/2020 |
7519 |
7/05/2020 |
58526 |
1/06/2020 |
170039 |
|
19/03/2020 |
234 |
13/04/2020 |
9784 |
8/05/2020 |
61847 |
2/06/2020 |
174884 |
|
20/03/2020 |
263 |
14/04/2020 |
10303 |
9/05/2020 |
65015 |
3/06/2020 |
178914 |
|
21/03/2020 |
317 |
15/04/2020 |
11475 |
10/05/2020 |
67307 |
4/06/2020 |
183198 |
|
22/03/2020 |
360 |
16/04/2020 |
12491 |
11/05/2020 |
68822 |
5/06/2020 |
187400 |
|
23/03/2020 |
395 |
17/04/2020 |
13489 |
12/05/2020 |
72059 |
6/06/2020 |
191758 |
|
24/03/2020 |
416 |
18/04/2020 |
14420 |
13/05/2020 |
76306 |
7/06/2020 |
196515 |
|
25/03/2020 |
480 |
19/04/2020 |
15628 |
14/05/2020 |
80604 |
8/06/2020 |
199696 |
|
26/03/2020 |
580 |
20/04/2020 |
16325 |
15/05/2020 |
84495 |
9/06/2020 |
203736 |
|
27/03/2020 |
635 |
21/04/2020 |
17837 |
16/05/2020 |
88541 |
10/06/2020 |
208823 |
|
28/03/2020 |
671 |
22/04/2020 |
19250 |
17/05/2020 |
92273 |
11/06/2020 |
214788 |
|
29/03/2020 |
852 |
23/04/2020 |
20914 |
18/05/2020 |
94933 |
………………… |
……………. |
|
30/03/2020 |
950 |
24/04/2020 |
21648 |
19/05/2020 |
99483 |
………………… |
……………. |
|
Figure 1. Autocorrelation correlogram (ACF) estimated for the time series
|
Figure 2. Autocorrelation correlogram (ACF) estimated for the time series, with a second-order transformation
Tabla 2.Optimal parameters for the model
|
|
parameters |
BIC |
Mean error |
test |
|
|
ARIMA |
normalized |
absolute |
Ljung-Box |
|
Perú |
(0,2,9) |
13,475 |
7,775 |
0,040* |
|
Figure 3. Forecast of the number of COVID 19 cases, with 95% confidence intervals and observed cases of COVID 19; from June 12 to July 11, 2020
Table 3. Observed cases and forecast of the number of COVID 19 cases, with 95% confidence intervals from June 12 to July 11, 2020
|
Forecast |
||||
|
Confidence Interval: 95% |
||||
|
Day |
Observed |
ARIMA |
Limit lower |
Limite upper |
|
12/06/2020 |
220749 |
220596 |
216821 |
224394 |
|
13/06/2020 |
225132 |
226675 |
220300 |
233118 |
|
14/06/2020 |
229736 |
232952 |
223819 |
242221 |
|
15/06/2020 |
232992 |
239355 |
227227 |
251717 |
|
16/06/2020 |
237156 |
245776 |
230401 |
261518 |
|
17/06/2020 |
240908 |
252499 |
233612 |
271929 |
|
18/06/2020 |
244388 |
259233 |
236578 |
282653 |
|
19/06/2020 |
247925 |
265890 |
239218 |
293600 |
|
20/06/2020 |
251338 |
272444 |
241516 |
304743 |
|
21/06/2020 |
254936 |
279083 |
243973 |
315926 |
|
22/06/2020 |
257447 |
285805 |
246533 |
327204 |
|
23/06/2020 |
260810 |
292612 |
249163 |
338615 |
|
24/06/2020 |
264689 |
299503 |
251840 |
350183 |
|
25/06/2020 |
268602 |
306478 |
254548 |
361925 |
|
26/06/2020 |
272364 |
313539 |
257274 |
373857 |
|
27/06/2020 |
275989 |
320685 |
260010 |
385988 |
|
28/06/2020 |
279419 |
327916 |
262748 |
398327 |
|
29/06/2020 |
282365 |
335232 |
265483 |
410882 |
|
30/06/2020 |
285213 |
342635 |
268210 |
423660 |
|
1/07/2020 |
288477 |
350123 |
270926 |
436665 |
|
2/07/2020 |
292004 |
357698 |
273628 |
449903 |
|
3/07/2020 |
295599 |
365359 |
276313 |
463378 |
|
4/07/2020 |
299080 |
373107 |
278978 |
477094 |
|
5/07/2020 |
302718 |
380942 |
281622 |
491054 |
|
6/07/2020 |
305703 |
388864 |
284244 |
505263 |
|
7/07/2020 |
309278 |
396873 |
286842 |
519724 |
|
8/07/2020 |
312911 |
404970 |
289414 |
534438 |
|
9/07/2020 |
316448 |
413155 |
291960 |
549411 |
|
10/07/2020 |
319646 |
421428 |
294478 |
564643 |
|
11/07/2020 |
322710 |
429790 |
296969 |
580138 |
DISCUSSION
This research was carried out to predict the number of cases with COVID-19 from June 12 to July 11, 2020, in Peru using the Autoregressive Integrated Method of Moving Averages (ARIMA), to later compare them with the cases observed in order to find an approximation between both results.
It must be taken into account that the forecasts obtained from a univariate time series model are extrapolations of the observed data until the time the series ends, being in many cases very effective providing a reference point to predict future values of confirmed cases. Most series are stochastic, in that their past values can partially determine the future, so accurate forecasts are impossible (24).
Various authors (1,11,15-20), worldwide, have developed models for the prognosis of COVID-19 cases based on the ARIMA method. They have used certain statistics to evaluate the goodness of fit of the model showing good results in short-term forecasts.
The modeling carried out in this study has followed all the stages of the Box-Jenkins methodology (11, 22-23), to obtain the best predictive model. Although, some researchers have applied these stages, they have only mentioned some statistical parameters used in their construction.
Moftakhar L and Seif M(1), mention the use of the analysis of the autocorrelation coefficients (ACF), partial autocorrelation (PACF) and the Box-Ljung test; Singh RK et al(11), mention the use of the Akaike information criterion (AIC); Ceylan Z(15), mentions the use of the mean square error (RMSE), mean absolute error (MAE) and mean absolute percentage error (MAPE); Benvenuto D (16), mentions the use of the Augmented Dickey-Fuller unit root test (ADF) and the analysis of the autocorrelation coefficients (ACF) and partial autocorrelation (PACF); Yousaf M et al(17), mention the use of the analysis of the autocorrelation coefficients (ACF) and partial autocorrelation (ACF and PACF) and the Akaike information criterion (AIC); Hiteshi Tandon (18), mentions the use of the analysis of the autocorrelation coefficients (ACF) and partial autocorrelation (PACF) in addition to the variance, normality test, the mean absolute percentage error (MAPE), the Absolute Deviation of the Mean ( DAM) and mean squared deviation (MSD); Rishabh Tyagi et al (19), mention the use of the analysis of the autocorrelation coefficients (ACF) and partial autocorrelation (PACF), the Augmented Dickey-Fuller unit root test (ADF), and provide the confidence intervals (CI ) 95% for point estimates; Finally, Perone G (20)mentions the use of the Akaike information criterion (AIC), the analysis of the autocorrelation coefficients (ACF) and partial autocorrelation (PACF), the Augmented Dickey-Fuller unit root test (ADF ), the modified Elliott-Rothenberg-Stock (DF-GLS) unit root test, the mean absolute error (MAE), the normality test, the homoscedasticity, the Engle Lagrange multiplier test, and the Box test -Ljun, many of which coincide with those used in this investigation.
Although it is true that within the mathematical forecasting models, there are a variety of models, the ARIMA model has a higher fitting precision than the others (26). It captures seasonal and non-seasonal forecast trends; This study focuses on a non-seasonal model to describe the growth pattern over time. On the other hand, if a model uses statistical approaches for its selection and evaluation, it must be recognized that the number of cases is not true. Since ARIMA is the only official source of information available in the country, it can lead to an inaccurate forecast. Even with this limitation, the results suggest that the method can help estimate the outbreak dynamics and provide guidelines to stop or better control the increase in infections in the country. It is also evident that any attempt to control depends on the public policies dictated by the authorities and above all. The awareness of each citizen about the spread of COVID-19 and the lethal effects that an irresponsible behavior or practice can have, as a consequence, the health of an individual, a family, and community.
Likewise, this model allows to analyze the possible evolution of the contagion curve and to be able to compare the results with those of other countries to evaluate the actions that are being taken.
It should be clarified that this estimate is strongly related to the trend of the original series data, and the result of the forecasts can help to understand any sudden change in the prognosis of COVID-19 cases.
Within the limitation of the study, it can be mentioned that the precision of the forecast depends on the precision of the applied data, this means that there is no other additional evidence that can estimate the exact number of patients with COVID-19 since only the number of official cases reported by the National Institute of Health and the National Center for Epidemiology, Prevention and Control of Diseases of the Ministry of Health was considered.
CONCLUSION
Compared with the observed data, the results obtained with the ARIMA model show an adequate adjustment of the values. This model is easy to apply and interpret, but does not simulate the exact behavior over time. It can be considered a simple and immediate tool to approximate the number of cases.
Author’s contributions: Both authors have participated in the conception and design of the article, data collection, writing of the article, critical review of the article, approval of the final version. In addition,
DACS performed the analysis and interpretation of the data.
Funding: Self-financed
Conflict of interest: The authors declare no conflict of interest in the publication of this article.
Received: October 12, 2020
Accepted: December 12, 2020
Correspondence: Daniel Angel Córdova Sotomayor.
Address: Av. Sosa Peláez N°1111. Block 8. Dpto. 104. Cercado de Lima
Cell: 954682470
Email: cordova.sotomayor.d@upch.pe
REFERENCES