ORIGINAL ARTICLE
REVISTA DE LA FACULTAD DE MEDICINA HUMANA 2023 - Universidad Ricardo Palma10.25176/RFMH.v23i2.5638
IS DIET QUALITY AFFECTED BY NUTRITIONAL KNOWLEDGE
AND PRACTICES IN INDIVIDUALS DOING REGULAR PHYSICAL
ACTIVITY?: A CROSS-SECTIONAL STUDY
¿LA CALIDAD DE LA ALIMENTACIÓN EN INDIVIDUOS QUE REALIZAN ACTIVIDAD FÍSICA REGULAR, SE VE AFECTA POR
CONOCIMIENTOS Y
PRÁCTICAS NUTRICIONALES?: UN ESTUDIO TRANSVERSAL
Büşra Başpinar
 1b,
Nazlı Nur Aslan Çin
2,
1b,
Nazlı Nur Aslan Çin
2,
Ayşe Özfer Özçelik
1a
1Ankara University Institute of Health Sciences, Department of Nutrition and Dietetics, Ankara,
Turkey.
2Karadeniz Technical University Faculty of Health Sciences, Department of Nutrition and
Dietetics, Trabzon, Turkey.
aPhd.
bPhd student.
ABSTRACT
Background: This study aimed to determine the relationship between diet quality and nutrition knowledge (CN) and nutrition practices (NP) of people who perform physical activity (PA) regularly. Methods: Two hundred healthy individuals who attended the gym at least three times a week were studied. The quality of the diet is calculated using the Healthy Eating Index-2015 (HEI-2015). Linear regression models were used multiplex to assess associations between NC and PN scores and dietary variables. Results: Of the participants, 47.0% had poor NK and 48.0% were found to have poor NPs.It was determined that NP scores were significantly associated with whole grains, seafood, and herbal proteins and total diet quality (p<0.05), while the NK scores were not associated with diet quality or its components (p>0.05). A one-unit increase in the NK score resulted in a 26.7% increase in the consumption of snack meals adjusted for age, gender, educational level, body mass index(BMI), smoking status, alcohol consumption, and physical activity(PA)(p< 0.001). Assessment of the NP score was related to the main meals (β=0.065±0.013; 95%CI 0.04–0.09; p<0.001), consumption of snack meals (β=0.029±0.014, 95%CI 0.01–0.06; p<0.05), and total diet quality(β=0.894±0.329; 95%CI 0.24–1.54; p<0.05). Moreover, about 17% of the variability in the NP score could be explained by the NK scores. Conclusions: Elevated NK was associated with an increase in the NP scores and indirectly with an increase in diet quality. In order to see the beneficial effects of PA on health, individuals should be supported by a healthy diet, by increasing their NK.
Keywords: Diet quality, Physical activity, Eating habits, Nutritional knowledge, Nutritional practice. (Source: MeSH-NLM)
RESUMEN
Antecedentes: Este estudio tuvo como objetivo determinar la relación entre la calidad de la dieta y el conocimiento sobre nutrición (CN) y las prácticas de nutrición (PN) de las personas que realizan actividad física (AF) con regularidad. Métodos: Se estudiaron 200 individuos sanos que acudían al gimnasio al menos tres veces por semana. La calidad de la dieta se calculó utilizando el Índice de Alimentación Saludable-2015 (HEI-2015). Se utilizaron modelos de regresión lineal múltiple para evaluar las asociaciones entre las puntuaciones de CN y PN y las variables de la dieta. Resultados: De los participantes, el 47,0 % tenía CN deficiente y el 48,0 % tenía PN pobre. Se determinó que las puntuaciones de PN se asociaron significativamente con los granos integrales, los mariscos y las proteínas a base de hierbas y la calidad total de la dieta (p<0,05), mientras que los puntajes CN no se asociaron con la calidad de la dieta o sus componentes (p>0,05). Un aumento en una unidad en la puntuación CN resultó en un aumento del 26,7 % en el consumo de refrigerios ajustado por edad, sexo, nivel educativo, índice de masa corporal (IMC), tabaquismo, consumo de alcohol y actividad física (AF)(p<0,001). La evaluación del puntaje PN se relacionó con las comidas principales (β = 0,065±0,013; IC 95% 0,04–0,09; p<0,001), consumo de refrigerios (β = 0,029±0,014, IC 95% 0,01–0,06; p<0,05) y la calidad total de la dieta (β = 0,894±0,329; IC95% 0,24–1,54; p<0,05). Además, alrededor del 17% de la variabilidad en la puntuación PN podría explicarse por las puntuaciones CN. Conclusiones: CN elevada se asoció con un aumento en las puntuaciones de PN e indirectamente con un aumento en la calidad de la dieta. Para ver los efectos beneficiosos de la AF en la salud, las personas deben apoyarse en una dieta saludable, aumentando su CN.
Palabras Clave: Calidad de la dieta, Actividad física, Hábitos alimentarios, Conocimiento nutricional, Práctica nutricional. (Fuente: DeCS–BIREME)
INTRODUCTION
Balanced nutrition consists of taking different nutritional components and determining the correct
proportions to meet the energy and nutrient needs of an individual. This diet
is important for the improvement of exercise performance as well as health (1).
During exercise, glycogen stores may be exhausted in individuals; hence, dehydration and muscle damage
may occur. Therefore, adequate nutrition can reduce the fatigue of an individual,
help them exercise longer, and recover faster between workouts (2).
Although it has been determined that a balanced diet has beneficial effects on the health of athletes,
(1),
most athletes still have many nutritional deficiencies (3).
Some researchers have reported that nutritional errors in athletes or individuals who do regular
physical activity (PA) may be due to low nutritional knowledge (NK) and
under-nutrition counselling (4).
However, many athletes are still unable to interpret adequate nutritional information on proper food
intake (5).
Having inadequate education about healthy eating behaviors could result in an individual not making the
right food choices.
Several components of the Healthy Eating Index-2015 (HEI-2015) are comprised of foods or nutrients
associated with measures of physical performance or physical functioning
in observational studies, including fruits and vegetables, protein, and whole grains. Fruits,
vegetables, and whole grains can contribute to meeting carbohydrate and antioxidant
intake recommendations, while animal, seafood, and plant proteins can contribute to meeting protein and
iron intake recommendations (6),
A higher total score obtained from the HEI-2015 was found to be associated with physical performance
measures in individuals who did regular PA, but the NK and NPs of
participants were not investigated(7).
A lack of correct information can lead to incorrect food selection and nutrient deficiencies, which can
negatively affect diet quality and exercise performance
(8).
Many studies have stated that athletes with higher NK scores had better diet quality (7,8).
However, Rash et al. (9) determined that a low NK score was significantly
correlated with dietary intake (9).
In another study, there was no significant relationship between the NK and NP scores (10).
The European Health and Fitness Association has stated that fitness centers can be useful in the
promotion of PA and prevention of chronic diseases (11).
In recent years, the attraction of fitness centers has increased due to socialization, the desire to
increase PA, and body image anxiety (12).
However, the expected benefit of fitness centers on health by health professionals (13).
has not been fully recognized (14)
Therefore, an evaluation of the diets and nutritional information of individuals who go to fitness
centers is necessary.
It is still unknown whether the NK level has an effect on diet quality in regularly training
individuals. Thus, it has often been reported that athletes have poor NK
scores (4).
If it is proven that there is a relationship between NK and diet quality, it is thought that exercise
performance will increase, as the dietary quality of individuals
who do sports will improve with nutritional training intervention. This research was conducted to
determine the relationship between dietary quality, and the NK and
NPs of individuals who did the physical activity (PA) regularly.
MATERIALS AND METHODS
Study population
This was a cross-sectional study evaluating the relationship between NK, NPs, dietary intake, and
quality of diet. Recruited into the study were 200 individuals, between
19 and 64 years of age, who did regular PA and applied to one of three chosen fitness centers between
October 2017 and July 2018. The sample size was calculated using the
GPower Analysis software. A minimum of 200 participants were necessary in order to achieve the Type I
error (α) = 0.05, effect size 0.08, and power 80%. Approval of the Ethics
Committee was received from a University (56786525-050.04.04/82713) and the Helsinki Declaration
principles were followed in the research.
Participants who registered at three selected fitness centers and came to the fitness centers at least
three times a week were accepted into the study. Participants with a history
of diabetes and/or hypertension, previous glucose or lipid metabolism drug prescriptions, and pregnant
women were excluded. Research data were collected using survey forms and
face-to-face interviews. The questionnaire consisted of questions about sociodemographic
characteristics, dietary habits, anthropometric measurements, a NK and NP questionnaire,
and 24-h dietary recall. The number of main meals, number of snacks, eating at night, and using dietary
supplements were inquired about in the dietary habits section. Moreover,
the individuals were asked from whom or where they learned about the nutritional information. Before the
survey, each participant was verbally informed about the contents of the
research and asked to sign an informed consent form indicating that they voluntarily agreed to
participate in the research.
Assessment of Sport Nutritional Knowledge and Practices
To evaluate the NK of the individuals, 29 questions were asked using a three-point Likert-type scale (I
agree, I do not know, I do not agree). Scoring comprised 1 point for each
correct answer and 0 points for the wrong answer. The lowest and highest NK scores that could be
obtained were between 0 and 29, and as the score increased, the NK increased.
The continuous variable of NK was categorized as poor (< 21 points) and good (≥21 points). The
Cronbach alpha of the NK questions was 0.841.
To evaluate the NPs 18 questions were asked, with 1 point given for correct NPs and 0 points for wrong
NPs. The lowest and highest NP scores that could be obtained were between
0 and 18, and as the score increased, the NPs increases. The total NP scores were categorized as poor
(< 13 points) and good (≥13 points). The Cronbach alpha of the NP questions
was 0.639.
Anthropometric Measurements
The bodyweight of the participants, wearing light clothing, and without shoes and socks, was measured to the nearest 0.5 kg using a digital scale. Height was measured to the nearest 0.1 cm using a calibrated stadiometer (Seca 217, Germany). Body mass index (BMI) was calculated for all of the individuals and classified as underweight for <18.5 kg/m2, normal for 18.5–24.9 kg/m2, and overweight/obese for ≥25.0 kg/m2 (15).
Physical activity assessment
PA was assessed using the validated Turkish version of the International Physical Activity Questionnaire (IPAQ)-short form. Eleven PA items were used to define the total minutes in the last seven days spent on inactivity, walking, and moderate- and vigorous-intensity PA. Responses were converted to metabolic equivalent task (MET) hours per week (MET-h/week): walking = 3.3 METs × d × h, moderate PA = 4 METs × d × h, and vigorous PA = 8 METs × d × h. The total MET scores were calculated by summing up the weekly MET values for the three activity types. Participants of the study were classified in three different groups of PA considering the MET-min/week of the sum of walking, moderate-intensity PAs, and vigorous-intensity PAs: low active (< 600 MET-min/week), moderately active (≥600 MET-min/week), and highly active (≥3000 MET-min/week).
Dietary Intake
The one-day food intake records of the participants were obtained using the 24-h recall (24-HR) method. A photo catalog of foods and nutrients was presented to the participants to obtain accurate measures and amounts. The Photo Catalog of Foods and Nutrients: Measures and Amounts was used to determine the portion sizes of the consumed foods. The average energy and nutritional facts of the consumed foods were calculated using the Nutritional Information Systems Package Program.
Diet Quality (HEI-2015)
The HEI-2015 reflects the 2005–2015 Dietary Guidelines for Americans (DGA) as an energy-adjusted measure of nutrients (i.e. scores per 1000 calories). This index consists of nine adequacy and three moderation components, with a maximum score of 100. Of the adequacy components, six include total fruits (fruit, juice and canned fruit), whole fruit (fruits excluding juice), total vegetables, seafood and plant proteins, greens and beans, and total protein foods; each scored at 5 points for the highest consumption and 0 points for the lowest consumption. A maximum of 10 points were given to the other adequacy components (whole grains, dairy, and fatty acids). The three moderation components (refined grain, sodium, empty calories) were scored in the range of 0–10, as a higher score indicated lower consumption. Higher scores for all of the components indicated a more healthy diet and greater adherence to the DGA recommendations.
Statistical Analyses
Descriptive statistics for the sociodemographic and anthropometric characteristics were presented as the mean ± SD or as a proportion of the total sample size. The mean intake of nutrients and the HEI-2015 components were also generated. Multiple-adjusted linear regression models were used to assess associations between the NK and NP scores, and the diet variables. The outcome variables included total dietary, total fruit, whole fruits, total vegetables, greens and beans, whole grains, dairy, total protein foods, seafood and plant proteins, fatty acids, refined grains, sodium, added sugars, saturated fats scores, total energy, macronutrients, and fiber. Regression models were adjusted for confounding variables including age (years), BMI (kg/m2), smoking status (yes versus no), and PA (yes versus no). Statistical significance levels were evaluated at p<0.05
RESULTS
The characteristics, and NK and NPs of the 200 participants are presented in Table 1. The mean age was 25.9 ± 7.6 years. The mean BMI was 23.5 ± 2.9 kg/m2, with a significant difference with regards to gender. More than half of the participants (69.5%) had a medium MET score. According to the MET score, 30.2% of men had high scores, while 10.8% of female had low scores (p<0.05). The mean NK and NP scores were 19.9 ± 3.8 and 12.5 ± 2.3, respectively. Overall, there was no significant difference in the NK and NP scores in terms of gender (p>0.05).
Table 1. Sociodemographic characteristics of participants by gender.
|
Characteristics |
Total (n=200) |
Gender |
p |
|
|---|---|---|---|---|
|
Female (n=74) |
Men (n=126) |
|||
|
Age (year)⸸ |
25.9±7.6 |
25.2±6.6 |
26.3±8.1 |
0.320 |
|
Education level |
|
|
|
|
|
Collegiate |
78 (39.0) |
23 (31.1) |
55 (43.7) |
0.099 |
|
Non-collegiate |
122 (61.0) |
51 (68.9) |
71 (56.3) |
|
|
Current smoker |
39 (19.5) |
9 (12.2) |
30 (23.8) |
0.013* |
|
Consuming alcohol |
86 (43.0) |
22 (29.7) |
64 (50.8) |
0.005* |
|
Body mass index⸸ |
23.5±2.9 |
21.6±2.6 |
24.6±2.6 |
.001** |
|
Underweight |
6 (3.0) |
6 (8.1) |
- |
0.001** |
|
Normal |
135 (67.5) |
63 (85.1) |
72 (57.1) |
|
|
Overweight and Obese |
59 (29.5) |
5 (6.8) |
54 (42.9) |
|
|
MET score⸸ |
2350.7±1465.0 |
1890.0±1185.7 |
2621.3±1548.1 |
0.001* |
|
Low |
15 (7.5) |
8 (10.8) |
7 (5.6) |
0.005* |
|
Medium |
139 (69.5) |
58 (78.4) |
81 (64.3) |
|
|
High |
46 (23.0) |
8 (10.8) |
38 (30.2) |
|
|
Dietary supplement |
16 (8.0) |
- |
16 (8.0) |
- |
|
NK score⸸ |
19.9±3.8 |
20.2±3.4 |
19.6±4.1 |
0.279 |
|
Poor (<21 score) |
94 (47.0) |
33 (44.6) |
61 (48.4) |
0.661 |
|
Good (≥21 score) |
106 (53.0) |
41 (55.4) |
65 (51.6) |
|
|
NP score⸸ |
12.5±2.3 |
12.9±2.0 |
12.3±2.4 |
0.069 |
|
Poor (<13 score) |
96 (48.0) |
33 (44.6) |
63 (50.0) |
0.468 |
|
Good (≥13 score) |
104 (52.0) |
41 (55.4) |
63 (50.0) |
|
|
NK: Nutrition knowledge; NP: Nutrition practice; MET: Metabolic Equivalent of
Task. |
||||
It was determined that 70.2% of individuals with poor NK scores and 55.4% of those with good NK scores consumed three main meals, but no significant difference was found between the two groups. However, participants with good NP scores more significantly consumed three main meals than those with poor NP scores (p<0.001). While individuals with poor NK scores consumed snacks more frequently (p<0.05), there was no difference in the NP scores (p>0.05).
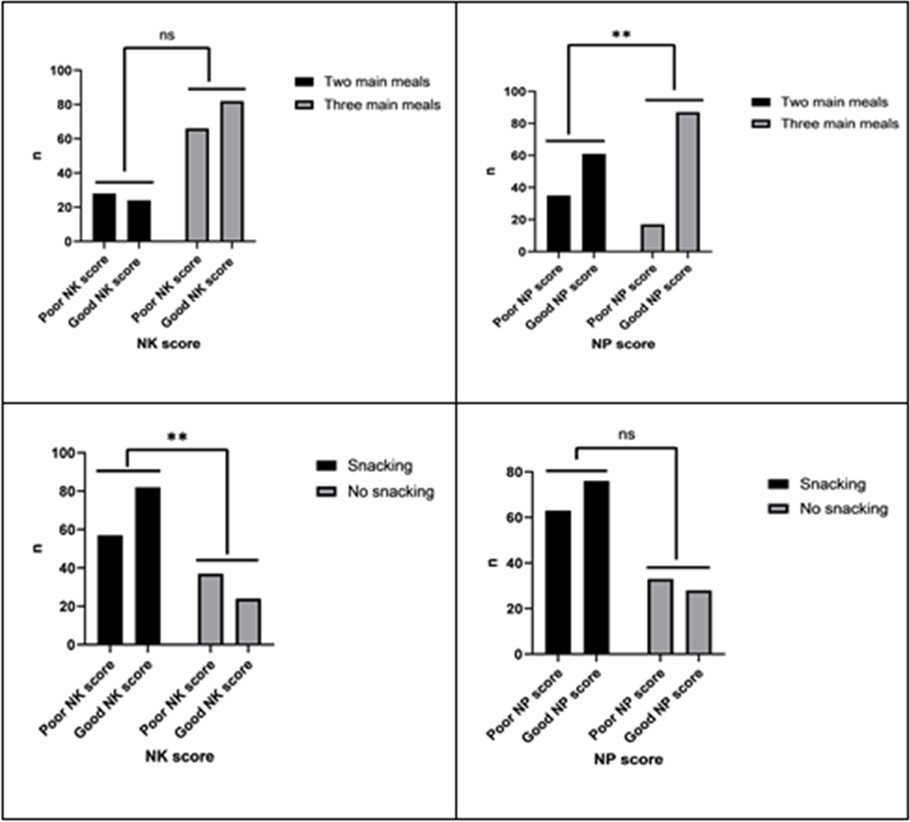
*p<0.05, **p<0.001.
Figure 1: Meals pattern according to participants NK and NP Scores.
Average intakes for nutrients of interest for the individuals who completed the one-day 24-HR are shown in Table 2. The average energy intake of the participants was 1886.6 ± 810.8 kcal/day. There were no significant differences between the total energy intake, and NK and NP scores (p>0.05). Intakes of protein, riboflavin, iron, zinc, and potassium of individuals with good NK scores were higher than those with poor scores (p<0.05). However, there were no significant differences between the NP scores and intake of energy and nutrients (p>0.05).
Table 2. Assessment of energy and nutrients according to participants NK and NP scores.
|
Energy and nutrients |
NK Score |
p |
NP Score |
p |
||
|---|---|---|---|---|---|---|
|
Poor (n= 4) |
Good (n=106) |
Poor (n=96) |
Good (n=104) |
|||
|
Energy (kcal) IQR |
1700.4 (1310.3-2158.6) |
1728.7 (1390.6-2396.3) |
0.400 |
1686.8 (1262.3-2271.4) |
1755.3 (1396.3-2280.6) |
0.601 |
|
Carbohydrate (g) IOR |
147.8 (110.3-208.0) |
147.5 (108.5-206.4) |
0.806 |
157.6 (108.9-202.5) |
142.0 (108.7-217.9) |
0.957 |
|
Protein (g) IOR |
75.6 (52.7-103.3) |
89.1 (62.8-121.9) |
0.045* |
82.2 (54.7-108.6) |
83.8 (59.4-121.5) |
0.466 |
|
Total fat (g) IOR |
82.9 (59.9-108.1) |
87.5 (62.8-121.4) |
0.290 |
90.9 (43.2) |
91.4 (42.3) |
0.978† |
|
Thiamin (mg) IOR |
0.78 (0.53-1.04) |
0.83 (0.65-1.07) |
0.148 |
0.74 (0.56-1.03) |
0.85 (0.64-1.07) |
0.145 |
|
Riboflavin (mg) IOR |
1.3 (0.87-1.77) |
1.6 (1.14-1.97) |
0.046* |
1.43 (0.95-1.84) |
1.47 (1.10-1.96) |
0.346 |
|
B12 vitamin (µg) IOR |
4.2 (2.40-7.01) |
4.4 (2.20-7.58) |
0.433 |
4.4 (2.70-7.07) |
4.3 (2.5-7.4) |
0.561 |
|
C vitamin (mg) IOR |
66.8 (42.8-116.0) |
62.6 (38.1-112.0) |
0.458 |
66.9 (42.8-98.2) |
62.2 (40.4-113.9) |
0.935 |
|
A vitamin (µg) IOR |
964.2 (574.5-1487.7) |
939.8 (622.6-1602.4) |
0.641 |
928.5 (673.5-1502.0) |
990.7 (520.8-1551.8) |
0.803 |
|
E vitamin (mg) IOR |
15.4 (11.3-22.9) |
18.5 (10.5-25.7) |
0.433 |
15.9 (11.2-24.6) |
17.6 (10.5-24.3) |
0.718 |
|
Calcium (mg) IOR |
581.1 (462.4-831.6) |
678.2 (491.0-899.7) |
0.108 |
628.5 (477.2-867.6) |
652.0 (491.9-885.4) |
0.550 |
|
Iron (mg) IOR |
10.5 (7.7-13.8) |
11.7 (9.1-14.9) |
0.031* |
10.8 (7.8-14.4) |
11.6 (8.6-14.6) |
0.252 |
|
Zinc (mg) IOR |
9.3 (6.6-12.9) |
10.9 (7.4-14.4) |
0.046* |
9.6 (6.7-13.6) |
10.7 (7.3-13.7) |
0.360 |
|
Potassium (mg) IOR |
2.1 (1.6-2.7) |
2.4 (1.9-3.0) |
0.025* |
2.2 (1.6-2.7) |
2.3 (1.7-2.9) |
0.316 |
|
Sodium (mg) IOR |
3.5 (2.1-4.2) |
3.0 (2.3-4.6) |
0.850 |
3.4 (1.5) |
3.6 (1.7) |
0.764† |
|
NK: Nutrition knowledge; NP: Nutrition practice; IQR: Interquartile range. †Data were presented as mean and standard deviation (SD), and Independent t-test was used. Other data were presented as median (IQR), and Mann Whitney U test was used. *p<0.05 |
||||||
The total HEI scores are given in Tabla 3 for the evaluation of the dietary quality of the participants according to the NK and NP scores. The average diet quality score was 60.9 ± 10.7 among the participants. There were no significant differences in the total diet quality and component scores of the participants according to NK and NP scores (p>0.05). The total diet quality, whole grains, and seafood and herbal proteins scores of individuals with good NP scores were higher (p<0,05).
Table 3. Assessment of total HEI (2010) scores according to participants NK and NP scores.
|
HEI (2010) |
CN Score |
p |
PN Score |
p |
||
|---|---|---|---|---|---|---|
|
Poor (n=94) |
Good (n=106) |
Poor (n=96) |
Good (n=104) |
|||
|
Total fruits (5) |
0.27 (0.0-2.94) |
0.31 (0.0-2.69) |
0.679 |
0.12 (0.0-2.81) |
0.65 (0.0-2.87) |
0.176 |
|
Whole fruit (5) |
0.52 (0.0-5.0) |
0.42 (0.0-4.89) |
0.947 |
0.25 (0.0-5.0) |
0.94 (0.0-5.0) |
0.321 |
|
Total vegetables (5) |
2.92 (1.48-4.15) |
2.81 (1.27-4.11) |
0.684 |
3.15 (1.88-4.05) |
2.66 (1.28-4.25) |
0.293 |
|
Dark green-leafy vegetables and legumes (5) |
5.0 (3.10-5.0) |
5.0 (1.88-5.0) |
0.428 |
5.0 (2.53-5.0) |
5.0 (2.0-5.0) |
0.557 |
|
Whole grains (10) |
3.02 (0.0-9.60) |
3.34 (0.0-10.0) |
0.924 |
1.33 (0.0-7.88) |
5.97 (0.0-10.0) |
0.023* |
|
Milk group (10) |
3.69 (1.87-6.13) |
4.29 (2.02-6.74) |
0.568 |
3.69 (1..86-5.73) |
4.43 (2.01-7.13) |
0.198 |
|
Total Protein (5) |
5.0 (5.0-5.0) |
5.0 (5.0-5.0) |
0.586 |
5.0 (5.0-5.0) |
5.0 (5.0-5.0) |
.585 |
|
Seafood and herbal protein (5) |
3.14 (0.0-5.0) |
2.63 (0.0-5.0) |
0.683 |
2.39 (0.0-5.0) |
2.99 (0.0-5.0) |
0.032* |
|
Fatty acids (10) |
8.71 (4.38-10.0) |
7.53 (4.23-10.0) |
0.566 |
7.82 (4.48-10.0) |
8.08 (4.31-10.0) |
0.677 |
|
Refined grains (10) |
3.27 (0.0-10.0) |
4.67 (0.0-10.0) |
0.476 |
3.10 (0.0-10.0) |
4.82 (0.0-10.0) |
0.402 |
|
Sodium (10) |
0.0 (0.0-7.08) |
2.08 (0.0-6.70) |
0.416 |
0.94 (0.0-6.99) |
0.01 (0.0-6.20) |
0.521 |
|
Empty Calories (20) |
20.0 (20.0-20.0) |
20.0 (20.0-20.0) |
0.324 |
20.0 (20.0-20.0) |
20.0 (20.0-20.0) |
0.354 |
|
Total diet quality (100)† |
60.5 (10.6) |
61.2 (10.9) |
0.662 |
59.1 (10.9) |
62.6 (10.4) |
0.021* |
|
NK: Nutrition knowledge; NP: Nutrition practice; HEI: Healthy Eating Index. †Data were presented as mean and standard deviation (SD), and Independent t-test was used. Other data were presented as median (IQR), and Mann Whitney U test was used. *p<0,05 |
||||||
Higher NK scores were significantly associated with a higher consumption of snacks (B = 0.032 ± 0.008; 95% CI: 0.02–0.05; p<0.001), but were not significantly positively associated with main meals (B = 0.015 ± 0.008; 95% CI: –0.01–0.03; p>0.05) or total diet quality (B = 0.167 ± 0.199; 95% CI: –0.23–0.55; p>0.05) (Tabla 4). A 1-unit increase in the NK score resulted in a 26.7% increase in the consumption of snacks adjusted for age, gender, educational level, BMI, smoking status, alcohol consumption, and PA. Assessment of the NP scores was related to main meals (B = 0.065 ± 0.013; 95% CI: 0.04–0.09; p < 0.001), the consumption of snacks (B = 0.029 ± 0.014, 95% CI: 0.01–0.06; p<0.05), and total diet quality (B = 0.894 ± 0.329; 95% CI: 0.24–1.54; p<0.05). As the NP scores of the participants increased, the number of main meals increased by 35.2%, snack consumption increased by 15.2%, and total diet quality increased by 19.4% (p<0.05), adjusted for covariates. Knowledge of nutrition significantly predicted attitudes toward the related measures in individuals who did PA regularly (B = 0.276 ± 0.118, 95% CI: 0.04–0.50; p<0.05). Almost 17% of the variability in the NPs of individuals who did PA regularly could be explained by their NK scores.
Table 4. Multiple linear regression analysis of associations between NK, NP scores and nutritional behavior.
|
Predictors |
Outcome |
Models |
B |
SE |
β |
95% Cl |
p |
|---|---|---|---|---|---|---|---|
|
NK Score⸸ |
Main meals |
Crude |
0.015 |
0.008 |
0.134 |
-0.01-0.03 |
0.059 |
|
Adjusteda |
0.016 |
0.008 |
0.137 |
-0.01-0.03 |
0.058 |
||
|
Snack meals |
Crude |
0.032 |
0.008 |
0.266 |
0.02-0.05 |
<0.001* |
|
|
Adjusteda |
0.032 |
0.008 |
0.267 |
0.02-0.05 |
<0.001* |
||
|
Total diet quality |
Crude |
0.167 |
0.199 |
0.060 |
-0.23-0.55 |
0.402 |
|
|
Adjusteda |
0.102 |
0.201 |
0.036 |
-0.29-0.49 |
0.611 |
||
|
NP Score |
Crude |
0.276 |
0.118 |
0.164 |
0.04-0.50 |
0.020* |
|
|
Adjusteda |
0.282 |
0.120 |
0.168 |
0.05-0.51 |
0.019* |
||
|
NP Score⸸⸸ |
Main meals |
Crude |
0.065 |
0.013 |
0.339 |
0.04-0.09 |
<0.001* |
|
Adjusteda |
0.068 |
0.013 |
0.352 |
0.04-0.09 |
<0.001* |
||
|
Snack meals |
Crude |
0.029 |
0.014 |
0.144 |
0.01-0.06 |
0.042* |
|
|
Adjusteda |
0.031 |
0.014 |
0.152 |
0.03-0.06 |
0.031* |
||
|
Total diet quality |
Crude |
0.894 |
0.329 |
0.189 |
0.24-1.54 |
.007* |
|
|
Adjusteda |
0.916 |
0.330 |
0.194 |
0.26-1.57 |
0.006* |
||
|
B: Unstandardized coefficient; SE: standard error; β: Standardized coefficient; 95% Cl:
95% confidence interval; NK: Nutrition knowledge; NP: Nutrition practice. †Lower scores indicate poorer NK. ⸸⸸Lower scores indicate poorer NP. a Multiple linear regression analysis adjusted for age, gender, educational level, body mass index, smoking status, alcohol consumption and physical activity. *p<0.05, **p<0.001. |
|||||||
DISCUSSION
This study aimed to determine the relationship between dietary quality, and the NK and NPs of adults who
did PA regularly. With the understanding of the increasing importance
of PA, fitness centers have become very popular in recent years (11,16).
Exercise programs, especially due to concerns about body weight (16),
should be supported by a proper diet (8).
In this study, it was determined that the NP scores were significantly associated with whole grains,
seafood and herbal proteins, and total diet quality, while the NK scores were
not associated with diet quality and components. The NK score was found to be positively associated with
snacking frequency and NP scores. Moreover, as the NP score increased, the
main meal and snacking frequency also increased. During consultation or nutrition education, the NK,
NPs, food consumption, and diet quality of individuals should be taken into
consideration (17).
To our knowledge, this study was the first to examine the effect of nutritional information on the diet
quality of individuals who did regular PA. Previous studies have mostly
focused on athletess (4,5,18).
However, although there is a large majority of individuals going to fitness centers, NK and behaviors
are not emphasized.
PA together with proper nutrition is vital in the prevention and treatment of obesity and chronic
disease, which is rapidly increasing, both in the world and in Turkey
(19).
The World Health Organization stated that 39% of the world population is overweight and 13% is obese,
while the Organization for Economic Co-operation and Development reported
that 64.4% of adults are overweight and obese in Turkey (20).
In this study, 29.5% of the participants were overweight and obese. The fact that obesity was lower than
the general population was thought to be due to the fact that
the participants did regular PA. This situation was also predicted to be effective in preventing chronic
diseases. For this reason, it would be beneficial to give a
recommendation to increase physical activity.
It has been argued that the diet and physical activities of an individual are affected by their
knowledge and practices (21).
NK triggers healthy eating behaviors and plays an important role in meeting these requirements
throughout the lifetime of the individual (22).
Adequate nutrition, which can be achieved with sufficient NK, is important for individuals who do PA by
optimizing the intake of energy and macro/micro nutrients
(23).
While some studies have found a correlation between dietary intake and NK in athletes (4,18),
nutritional information has not always been associated with healthy food selection (10)
It is difficult to examine the relationship between NK and diet (8).
Therefore, in this study, the evaluation was made on diet quality. Contrary to expectations, NK did not
correlate with dietary quality components or total diet quality (p>0.05).
In a systematic review examining the relationship between nutritional information and diet quality, no
relationship was found in 10 of 29 studies, and a significant, positive,
but weak relationship was found in the rest (8)
These results were not sufficient to say that NK is ineffective on food intake, correct food selection,
or diet quality. NPs are affected by many factors, such as beliefs, culture,
self-efficacy, and NK (24).
It is aimed to achieve positive changes in food intake by increasing NK (25).
In this study, a one-unit increase in the NK score was found to be associated with a 16% increase in the
NP score. There was a significant positive correlation between the NP
score and whole grains, seafood and herbal protein, and total diet quality (p<0.05). It was thought
that individuals who did regular PA turned to whole grains and protein
foods to increase the feeling of fullness. The total diet quality also presented important results. In
one study, a 0.45-unit decrease in the healthy dietary pattern score was
associated with an approximately 500-kcal increase in daily energy intake and an increase in the
consumption of chips, and fried and roasted potatoes (26).
Based on this study, it can mention that NK and NPs play a significant role in maintaining general
health and healthy body weight.
The energy intake and meal frequency of physically active individuals play a role in achieving their
goals and maintaining energy balance (27).
There are three main meal consumptions based on adequate and balanced nutrition. The consumption of
three main meals a day is generally one of the recommendations in
country-specific guidelines (28).
It has been claimed that the consumption of three main meals a day facilitates the intake of the
nutrients necessary for the body, the quality of the diet, and serving
control (29).
It has been recommended by different authorities that individuals should snack 1–3 times a day (30).
In this study, it was determined that a one-unit increase in the NK score increased the snacking
frequency by 26%, and this relationship remained significant after adjusted
confounding variables. The increase in the NP score significantly increased the quality of diet, and
main meal and snacking frequency (p<0.05). This showed the importance
of nutritional information to meet the requirements of individuals who do PA.
Strengths and limitations
Although this paper provided significant data on the relationship between the NK and NP scores, and diet quality, there were a few limitations. First, due to its cross-sectional design, the results may not have applied to the general population. Furthermore, the NK and NP scores, and dietary intake were self-reported, which may have over or underestimated the actual scores. Objective evaluation of the diet records may reveal more precise results. Finally, studies conducted on a wider range of individuals who do regular PA are required to confirm the findings. Despite all of these limitations, this study provided new perspectives into the current literature on NK and NP scores, and diet quality, and was the first to determine the relationship between NK, NPs, and diet quality in individuals who did regular PA. Moreover, this data will provide insight into the potential factors influencing the dietary habits and diet quality that forms the basis of targeted education programs.
CONCLUSIONs
In recent years, with emphasis on the importance of PA, the number of people going to fitness centers has increased. This study was the first to draw attention to the NK and diet quality of this population. Cross-sectional data from a sample of individuals who did regular PA found that poor NPs were associated with lower main meal and snack consumption, and diet quality. One of the important results of this study was that the NP score can be improved by increasing NK. Increasing NK may improve sports performance, and provide adequate and balanced nutrition education to individuals who are regularly PA, which may help them to develop better NPs and diet quality. Further studies investigating sports performance on NK and NPs in populations that are regularly PA may provide valuable data to better understand the relationship between dietary habits and diet quality.
Authorship contribution: The authors state that they are the creators of the entire
article.
Funding:
This research received no specific grant from any funding agency in the public, commercial, or
not-for-profit sectors.
Conflict of interest: None of the other authors reported a conflict of interest related
to this study. The authors
certify that there is no conflict of interest with any financial organization regarding the
material discussed in the manuscript.
Recevied:
February 13, 2022.
Aprobed:
April 23, 2023.
Corresponding author: Büşra BAŞPINAR.
Addess: Ankara Üniversitesi Sağlık Bilimleri Fakültesi, Keçiören, Ankara,
Türkiye.
Phone number: +90 553 437 5414
E-mail: busrabaspinar92@gmail.com
Article published by the Journal of the faculty of Human Medicine of the Ricardo Palma University. It is an open access article, distributed under the terms of the Creatvie Commons license: Creative Commons Attribution 4.0 International, CC BY 4.0 (https://creativecommons.org/licenses/by/1.0/), that allows non-commercial use, distribution and reproduction in any medium, provided that the original work is duly cited. For commercial use, please contact revista.medicina@urp.edu.pe.
BIBLIOGRAPHIC REFERENCES