Introduction
Breast cancer (BC) is a public health problem and is the current leading cause of cancer-related death among women worldwide
1
. Triple-negative breast cancer (TNBC) is frequently associated with early relapse, which leads to an increased risk of developing distant metastases and death compared to other subtypes
2
3
4
.
TNBC is defined by its lack of expression of estrogen receptor (ER), progesterone receptor (PR), and human epidermal growth factor 2 receptor (HER2) and accounts for approximately 15%-20% of all BC cases
5
. However, Latin American studies usually report higher percentages of new TNBC cases. In Peru and Colombia, TNBC prevalence rates are 21.3% and 20.6%, respectively
6
7
.
Despite pathologic tumor features (large tumor size, lymph node involvement, and advanced stages) having a clear association with worse survival outcomes
8
9
, early detection of TNBC remains a challenge in developing countries. A Peruvian study stated that only 7.2% of TNBC cases diagnosed between 2000 and 2014 were classified as stage I
10
.
Adjuvant chemotherapy is currently the only systemic treatment available for early-stage TNBC patients
11
. However, there is uncertainty around selecting TNBC T1N0M0 patients who would benefit from it to avoid overtreatment. Studies have shown contradictory results regarding this topic. For example, Yi Xing Ren et al. suggested that adjuvant chemotherapy improves recurrence-free survival (RFS) in T1cN0M0 TNBC patients but not in T1b
12
. On the other hand, a meta-analysis demonstrated the survival benefit of adjuvant chemotherapy for patients with pT1bN0 and pT1cN0 TNBC
13
. Therefore, there is a need to investigate the role of adjuvant chemotherapy in that population profile to provide clarity and improve the quality of life during treatment.
Thus, this study aims to evaluate the effect of adjuvant chemotherapy on overall survival (OS) and progression-free survival (PFS) among pT1N0M0 TNBC subgroups (pT1a/b vs. pT1c).
Materials and Methods
Design and study population
A retrospective study reported 2007 cases of TNBC diagnosed between January 2000 and December 2014 at the Instituto Nacional de Enfermedades Neoplásicas (INEN) in Lima, Peru. Immunohistochemistry (IHC) and fluorescent in situ hybridization (FISH) tests were used to identify these patients. Antibodies Estrogen Anti-Receptor (Clone 1D5, Dako), Progesterone Anti-Receptor (Clone PGR636, Dako), and Anti-HER2/neu (A0485, Dako) were used for IHC analysis. ER/PR negative was defined when <1% of cells showed any level of nuclear staining. According to the American Society of Clinical Oncology and College of American Pathologists (ASCO/CAP) guidelines
14
, HER2-negative was reported when the IHC score was 0/1+ or 2+ but corroborated by FISH negative (not amplified). Previous literature has already reported the demographic characterization of the overall cohort design
10
.
Eligibility criteria
We only included non-metastatic TNBC patients who underwent surgery as the first treatment, had residual disease classified as pT1N0M0 (tumor size ≤2 cm and negative axillary lymph nodes), and then received adjuvant chemotherapy. Exclusion criteria included male patients, cases with inflammatory breast tumors, and patients with missing data on tumor size, surgery type, chemotherapy, or surgery dates. Our study did not include TNBC patients who were reported to be treated with neoadjuvant chemotherapy.
Definition of variables
The 8th edition of the American Joint Committee on Cancer (AJCC)
15
was used to define clinicopathologic characteristics of the residual disease. pT1 classification was divided into three groups: T1a (>0.1cm and <0.5cm), T1b (>0.5cm), and T1c (>1cm). Overall survival (OS) and Progression-Free Survival (PFS) were calculated from surgery to death or first progression disease, respectively, or to the last contact.
Statistical analysis
Clinicopathologic characteristics between patients who received chemotherapy and those who did not by residual tumor size (pT1a/b vs pT1c) were described by percentages and tested by Pearson’s Chi-square test or Fisher’s exact test as appropriate. We reported the age of TNBC patients through the median and range. A comparison of the use of adjuvant chemotherapy for quantitative variables was tested using the ANOVA test. 5-year survival rates were estimated using the Kaplan-Meier method, and the Log-rank test determined differences in survival curves. A Univariate Cox proportional hazards model was used for determining hazard ratios (HR) and 95% confidence intervals (CIs) to identify risk factors for PFS. Data were analyzed with R software version 4.0.3 using the packages “survival” (version 3.5-5) and “survminer” (version 0.4.9). P-values<0.05 were considered statistically significant.
Ethical Considerations
The Ethics Review Board of the Instituto Nacional de Enfermedades Neoplasicas (Lima, Peru) approved the study, and all relevant ethical guidelines conducted it.
Results
Clinicopathologic characteristics
Our study included 124 patients diagnosed with T1N0 TNBC. According to Table 1, 30.6% (n=38) were reported as pT1a/b (pT1a = 13, pT1b = 25), while 69.4% (n=86) were pT1c. Overall median age was 51.0 (range: 43.8 – 61.0) years. Among pT1a/b patients, it was 52.5 (45.5 – 59.0) years and 49.5 (43.0 – 61.8) years within the pT1c patient group.
Regarding menopausal status, 61.0% (n=75) were postmenopausal, and the rest were classified as premenopausal (39.0%, n=48). This trend was evident in both the pT1a/b and pT1c groups (Table 1).
Around 60.2% (n=74) underwent conservative surgery and 39.8% (n=49) underwent mastectomy. pT1c patients tend to have more conservative surgery cases than pT1a/b patients. Moreover, the most common histological grade among the study population was G3 (69.4%, n=75). Similar proportions were evident between the pT1a/b (60.6%, n=20) and pT1c (73.3%, n=55) groups (Table 1).
The adjuvant treatments were chemotherapy and radiotherapy. 65.3% (n=81) of the population received adjuvant chemotherapy, and 55.6% (n=69) received radiotherapy. Adjuvant chemotherapy predominated in pT1c patients (72.1%, n=62, Table 1).
It was also observed that 8.9% (n=11) died. Patients diagnosed with pT1a/b and pT1c reported five and six deaths, respectively. On the other hand, around 13.7% (n=17) developed progression, with 7.9% in pT1a/b and 16.3% in pT1c, as indicated in Table 1.
Profile of pT1a/b and pT1c TNBC patients according to the use of adjuvant chemotherapy
In Table 2, pT1a/b patients who did not receive chemotherapy had a median age of 57.0 years (49.0 – 59.5), while those who did had 49.0 (39.5 – 57.5) years. On the other hand, for pT1c patients who were recommended chemotherapy, the median age was 48.5 (42.0 – 58.8). Among this group of patients, it was observed that those who did not receive treatment were significantly older (p=0.005, Table 2).
Most pT1a/b and pT1c patients who accessed chemotherapy complemented their treatment with radiotherapy. This proportion was significant for both groups (p=0.023, p=0.004). However, no significant differences were reported in menopausal status, type of surgery, histological grade, or overall survival in pT1a/b and pT1c patients according to the use of adjuvant chemotherapy.
Survival analysis
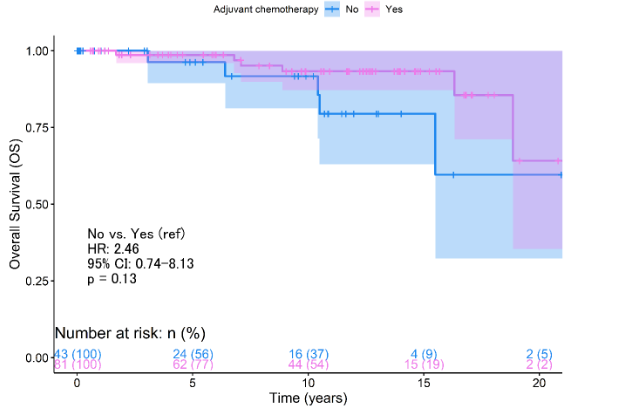
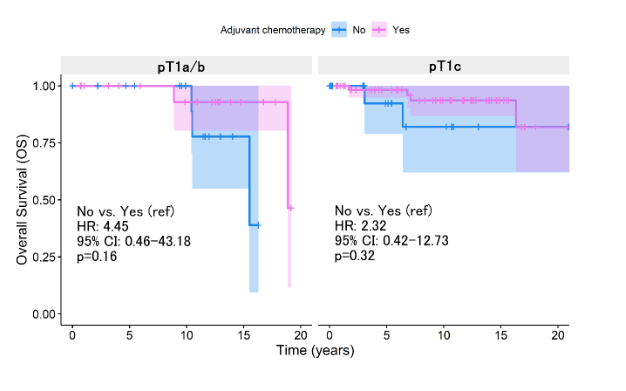
According to the Kaplan-Meier survival analysis, it was determined no significant differences in 5-year OS rates when evaluating the use of adjuvant chemotherapy (p=0.13, Figure 1A). This same trend was evident between the pT1a/b patient groups (p=0.159, Figure 1B) and pT1c (p=0.320, Figure 1B).
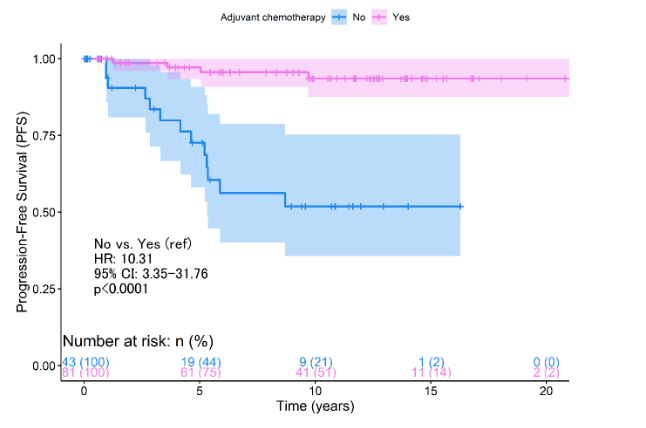
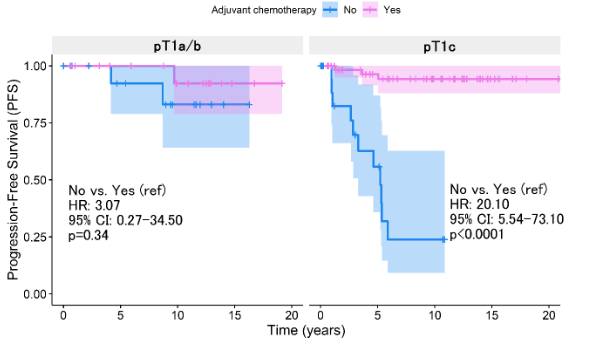
This landscape differed when PFS was analyzed, which at 5 years of follow-up showed a worse prognosis among patients who did not receive chemotherapy (p<0.0011, Figure 2A). However, the benefit of chemotherapy was only demonstrated as significant among pT1c patients (p<0.0001, Figure 2B). pT1a/b patients do not report improvement in relation to progression (p=0.340, Figure 2B). The Cox regression analysis concerning survival from progression reported that the absence of chemotherapy represents a risk factor (HR:10.3, 95% CI: 3.35 - 31.8, p<0.0001, Table 3). However, the statistical weight of this result lies in the fact that pT1c patients without chemotherapy have a 20.1 times higher risk than those who did access treatment (95% CI: 5.54 - 73.1, p<0.0001, Table 3).
Discussion
Our study aimed to determine the benefits of adjuvant chemotherapy among TNBC patients with early-stage tumors from residual disease (pT1N0M0).
It is well-known adjuvant chemotherapy is the only approved treatment for early-stage TNBC patients and is recommended even for those with small and lymph node-negative tumors according to the 2023 European Society for Medical Oncology (ESMO) Clinical Practice Guideline (CPG)
16
. It explains why more than half of our population received chemotherapy as a systematic treatment. This trend is also evident among pT1N0M0 TNBC patients from China, reaching 88.0%
13
.
However, evidence suggests an unclear benefit of adjuvant chemotherapy in T1N0M0 subgroups. Our analysis indicated an improvement in PFS because of treatment only among pT1cN0M0. pT1a/bN0M0 TNBC patients with adjuvant chemotherapy did not experience a better outcome, neither OS nor PFS, compared to those who were not treated. Similarly, Yi Xing Ren et al. demonstrated a significant RFS benefit in T1cN0M0 TNBC patients receiving adjuvant chemotherapy (HR: 0.24, 95% CI: 0.08-0.76, p=0.014). However, this effect was not observed in the T1b subgroup (HR=0.32, 95% CI: 0.03-3.18, p=0.330)
17
. Moreover, differences were not found between patients with T1mic/T1a TNBC tumors and patients with T1b tumors in the distant recurrence rate in the receipt of chemotherapy (95.9% vs 94.5%, respectively, p=0.63)
18
.
On the contrary, the impact of chemotherapy on OS and breast cancer-specific survival (BCSS) was illustrated by Carbajal-Ochoa et al., who showed that adjuvant chemotherapy improved OS in T1b TNBC (HR: 0.52, 95% CI: 0.41-0.68, p<0.001) but did not significantly affect BCSS (HR: 0.70, 95% CI: 0.45-1.07, p=0.10). In T1c, TNBC patients also reported an improvement in both OS (HR: 0.54, 95% CI: 0.47-0.62, p<0.001) and BCSS (HR: 0.79, 95% CI: 0.63-0.99, p=0.043)
19
. Despite these benefits, the application of chemotherapy in T1a tumors was questioned by Bravo-Solarte et al., who observed no improvement in OS or BCSS post-chemotherapy in this subgroup
20
.
Our study is limited by its retrospective nature that led us to grouped T1a/b due to the few cases available. An et al., in their meta-analysis, demonstrated that adjuvant chemotherapy significantly reduced the rate of disease recurrence for patients with T1a/b disease as a group. Still, the population driving that was only patients with T1b disease, not those with T1a disease
13
.
Another limitation was the lack of information on tumor-infiltrating lymphocytes (TILs) in clinical records of patients, which is the main reason this variable was not considered in our study. TILs have been identified as a prognostic biomarker in TNBC patients treated with adjuvant chemotherapy
21
. A retrospective study that included 182 systemically untreated TNBC patients found a subgroup of patients with ≥ 50% TILs had a decrease in invasive disease-free survival (iDFS) rates
22
. Park et al. also showed early TNBC patients with ≥ 30% TILs had excellent survival outcomes in the absence of adjuvant chemotherapy. Each 10% increment in TILs reduced the risk of iDFS, distant disease-free survival (D-DFS) and OS in 10% (95% CI, 0.82 to 0.97), 14% (95% CI, 0.77 to 0.95) and 12% (95% CI, 0.79 to 0.98), respectively
23
. In this sense, omitting TILs data could has limited our study since TILs play a promising role in predicting patient outcomes and guiding treatment decisions in early TNBC.
Tabla 1.
General characteristics
| Clinical characteristics |
Total (N = 1241) |
pT1a/b (N = 381) |
pTc (N = 861) |
| Age (years) |
51.0 (43.8, 61.0) |
52.5 (45.5, 59.0) |
49.5 (43.0, 61.8) |
| Age group (years) |
|
|
|
| 0-35 |
12 (9.7%) |
3 (7.9%) |
9 (10.5%) |
| 36-64 |
94 (75.8%) |
31 (81.6%) |
63 (73.3%) |
| 65+ |
18 (14.5%) |
4 (10.5%) |
14 (16.3%) |
|
Menopausal status |
|
|
|
| Postmenopausal |
75 (61.0%) |
26 (68.4%) |
49 (57.6%) |
| Premenopausal |
48 (39.0%) |
12 (31.6%) |
36 (42.4%) |
| NR2 |
1 |
0 |
1 |
| Type of surgery |
|
|
|
| Conservative |
74 (60.2%) |
21 (55.3%) |
53 (62.4%) |
| Mastectomy |
49 (39.8%) |
17 (44.7%) |
32 (37.6%) |
| NR2 |
1 |
0 |
1 |
| Histological grade |
|
|
|
| G1 |
1 (0.9%) |
0 (0.0%) |
1 (1.3%) |
| G2 |
32 (29.6%) |
13 (39.4%) |
19 (25.3%) |
| G3 |
75 (69.4%) |
20 (60.6%) |
55 (73.3%) |
|
NR3 |
17 |
5 |
12 |
|
Adjuvant chemotherapy |
|
|
|
| No |
43 (34.7%) |
19 (50.0%) |
24 (27.9%) |
| Yes |
81 (65.3%) |
19 (50.0%) |
62 (72.1%) |
| Adjuvant radiotherapy |
|
|
|
| No |
55 (44.4%) |
19 (50.0%) |
36 (41.9%) |
| Yes |
69 (55.6%) |
19 (50.0%) |
50 (58.1%) |
| Survival status |
|
|
|
| Deceased |
11 (8.9%) |
5 (13.2%) |
6 (7.0%) |
| Alive |
113 (91.1%) |
33 (86.8%) |
80 (93.0%) |
| Progression status |
|
|
|
| No |
107 (86.3%) |
35 (92.1%) |
72 (83.7%) |
| Yes |
17 (13.7%) |
3 (7.9%) |
14 (16.3%) |
Table 2.
Clinical Characteristics of pT1a/b and pT1c Patients According to Adjuvant Chemotherapy
| Clinical characteristics |
pT1a/b |
p-value |
pT1c |
p-value |
| No, N=191 |
Yes, N=191 |
No, N=241 |
Yes, N=241 |
| Age (Years) |
57.0 (49.0, 59.5) |
49.0 (39.5, 57.5) |
0.12 |
61.0 (46.5, 69.5) |
48.5 (42.0, 58.8) |
0.005 |
| Age group (years) |
|
0.7 |
|
0.27 |
| 0-35 |
1 (5.3%) |
2 (10.5%) |
|
1 (4.2%) |
8 (12.9%) |
|
| 36-64 |
15 (78.9%) |
16 (84.2%) |
|
15 (62.5%) |
48 (77.4%) |
|
| 65+ |
3 (15.8%) |
1 (5.3%) |
0.2 |
8 (33.3%) |
6 (9.7%) |
|
| Menopausal status |
|
0.2 |
|
0.12 |
| Postmenopausal |
15 (78.9%) |
11 (57.9%) |
|
17 (70.8%) |
32 (52.5%) |
|
| Premenopausal |
4 (21.1%) |
8 (42.1%) |
|
7 (29.2%) |
29 (47.5%) |
|
| NR2 |
- |
- |
|
- |
1 |
|
| Type of surgery |
|
0.10 |
|
0.14 |
| Conservative |
8 (42.1%) |
13 (68.4%) |
|
12 (50.0%) |
41 (67.2%) |
|
| Mastectomy |
11 (57.9%) |
6 (31.6%) |
|
12 (50.0%) |
20 (32.8%) |
|
| NR2 |
- |
- |
|
- |
1 |
|
| Histological grade |
|
0.13 |
|
0.086 |
| G1 |
1 (5.0%) |
0 (0.0%) |
|
7 (35.0%) |
12 (21.8%) |
|
| G2 |
8 (53.3%) |
5 (27.8%) |
|
12 (60.0%) |
43 (78.2%) |
|
| G3 |
7 (46.7%) |
13 (72.2%) |
|
5 |
7 |
|
| NR 3 |
4 |
1 |
|
5 |
7 |
|
| Adjuvant radiotherapy |
|
0.023 |
|
0.004 |
No |
13 (68.4%) |
6 (31.6%) |
0.023 |
16 (66.7%) |
20 (32.3%) |
|
| Yes |
6 (31.6%) |
13 (68.4%) |
|
8 (33.3%) |
42 (67.7%) |
|
| Survival status |
|
>0.9 |
|
0.7 |
Deceased |
3 (15.8%) |
2 (10.5%) |
|
2 (8.3%) |
4 (6.5%) |
|
| Alive |
16 (84.2%) |
17 (89.5%) |
|
22 (91.7%) |
58 (93.5%) |
|
| Progression Status |
|
>0.9 |
|
<0.001 |
No |
17 (89.5%) |
18 (94.7%) |
>0.9 |
13 (54.2%) |
59 (95.2%) |
|
| Yes |
2 (10.5%) |
1 (5.3%) |
|
11 (45.8%) |
3 (4.8%) |
|
1Median (range);n(%)
2Anova test; Pearson's Chi-squared test
3No reported
Table 3.
Cox univariate model for progression-free survival according to tumor size of residual disease
En conclusión, aunque la quimioterapia adyuvante mejora claramente los resultados en ciertos subgrupos de pacientes con CMTN, particularmente aquellas con enfermedad pT1cN0M0, su aplicación en tumores más pequeños como los T1a/b requiere una consideración cuidadosa. Las guías de consenso actuales recomiendan la quimioterapia en pacientes con CMTN T1b, reflejando un enfoque cauteloso hacia un subgrupo donde la evidencia de beneficio es mixta. La efectividad de la quimioterapia en diferentes tamaños tumorales dentro de la categoría T1N0M0 resalta la necesidad de estrategias de tratamiento personalizadas y la identificación de biomarcadores que puedan predecir la respuesta a la terapia. La investigación futura debe centrarse en refinar estas estrategias, como la inclusión de datos de TILs, para asegurar que las pacientes reciban el tratamiento más adecuado y eficaz, adaptado a su perfil de riesgo.
